x  = rand()		# 0〜1の実数 1個
x2 = rand(10) 	# 0〜1の実数 10個
x2 = rand(3,5) 	# 0〜1の実数 3x5の行列
x  = randint(10)			# 0~10 の整数を1個
x  = randint(0,10)			# 0~10 の整数を1個
x2 = randint(0,10,20)		# 0~10 の整数で1x20の配列
x2 = randint(0,10,(3,5))	# 0~10 の整数で3x5の行列
from numpy import *
x2 = random.choice( [-1,0,1], 100)      # -1,0,1 のいずれかの値を100コ
from numpy import *
x2 = random.choice( [-1,0,1], 10)
y2 = cumsum(x2)

## x2 が以下の場合
# x2 = [ 1  1  1 -1  1  0  0  1  1  1 ]
## cumsum(x2) は以下のようになります。
# y2 = [ 1  2  3  2  3  3  3  4  5  6 ]
# 平均60、標準偏差20 の 正規分布
x = normal(60,20)
# 100コ
x2 = normal(60,20, 100)
# 10x10コ
x2 = normal(60,20, (10,10))
# 標準正規分布に従う乱数。
x = randn()
# 10コ
x2 = randn(10)
# 10x10コ
x2 = randn(10,10)
from numpy.random import *
import matplotlib.pyplot as plt
x2 = randn(10000)	# 標準正規分布に従う10000個の乱数
plt.hist(x2, bins=50)   # 50本の縦棒で表示
plt.show()
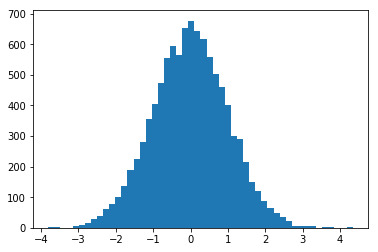 縦軸が個数。横軸が値。
from numpy.random import *

seed(1000)	# 毎回同じ値に設定。数値は適当。

x = rand()	# 毎回同じ値 0.6535895854646095

x = randn()	# 毎回同じ値 -0.8044583035248052

x2 = randn(10)	# 毎回同じ値を(10コ)
# [ 0.32093155 -0.02548288  0.64432383 -0.30079667  0.38947455 -0.1074373
# -0.47998308  0.5950355  -0.46466753  0.66728131 ]


seed()		# 毎回ランダムな乱数に
x = randn()	# 毎回異なる値
